Certainty on Tap
Know every pour is paid for & served clean.
PourScore™ matches every ounce poured to every ounce sold, on every line, in real time. It monitors temperature, pressure, cleanings, and after-hours pours. Draft profit certainty.
PourScore™ Overview Video
PROOF
Same taps. Same staff. Unsold pours down 98% in one week.
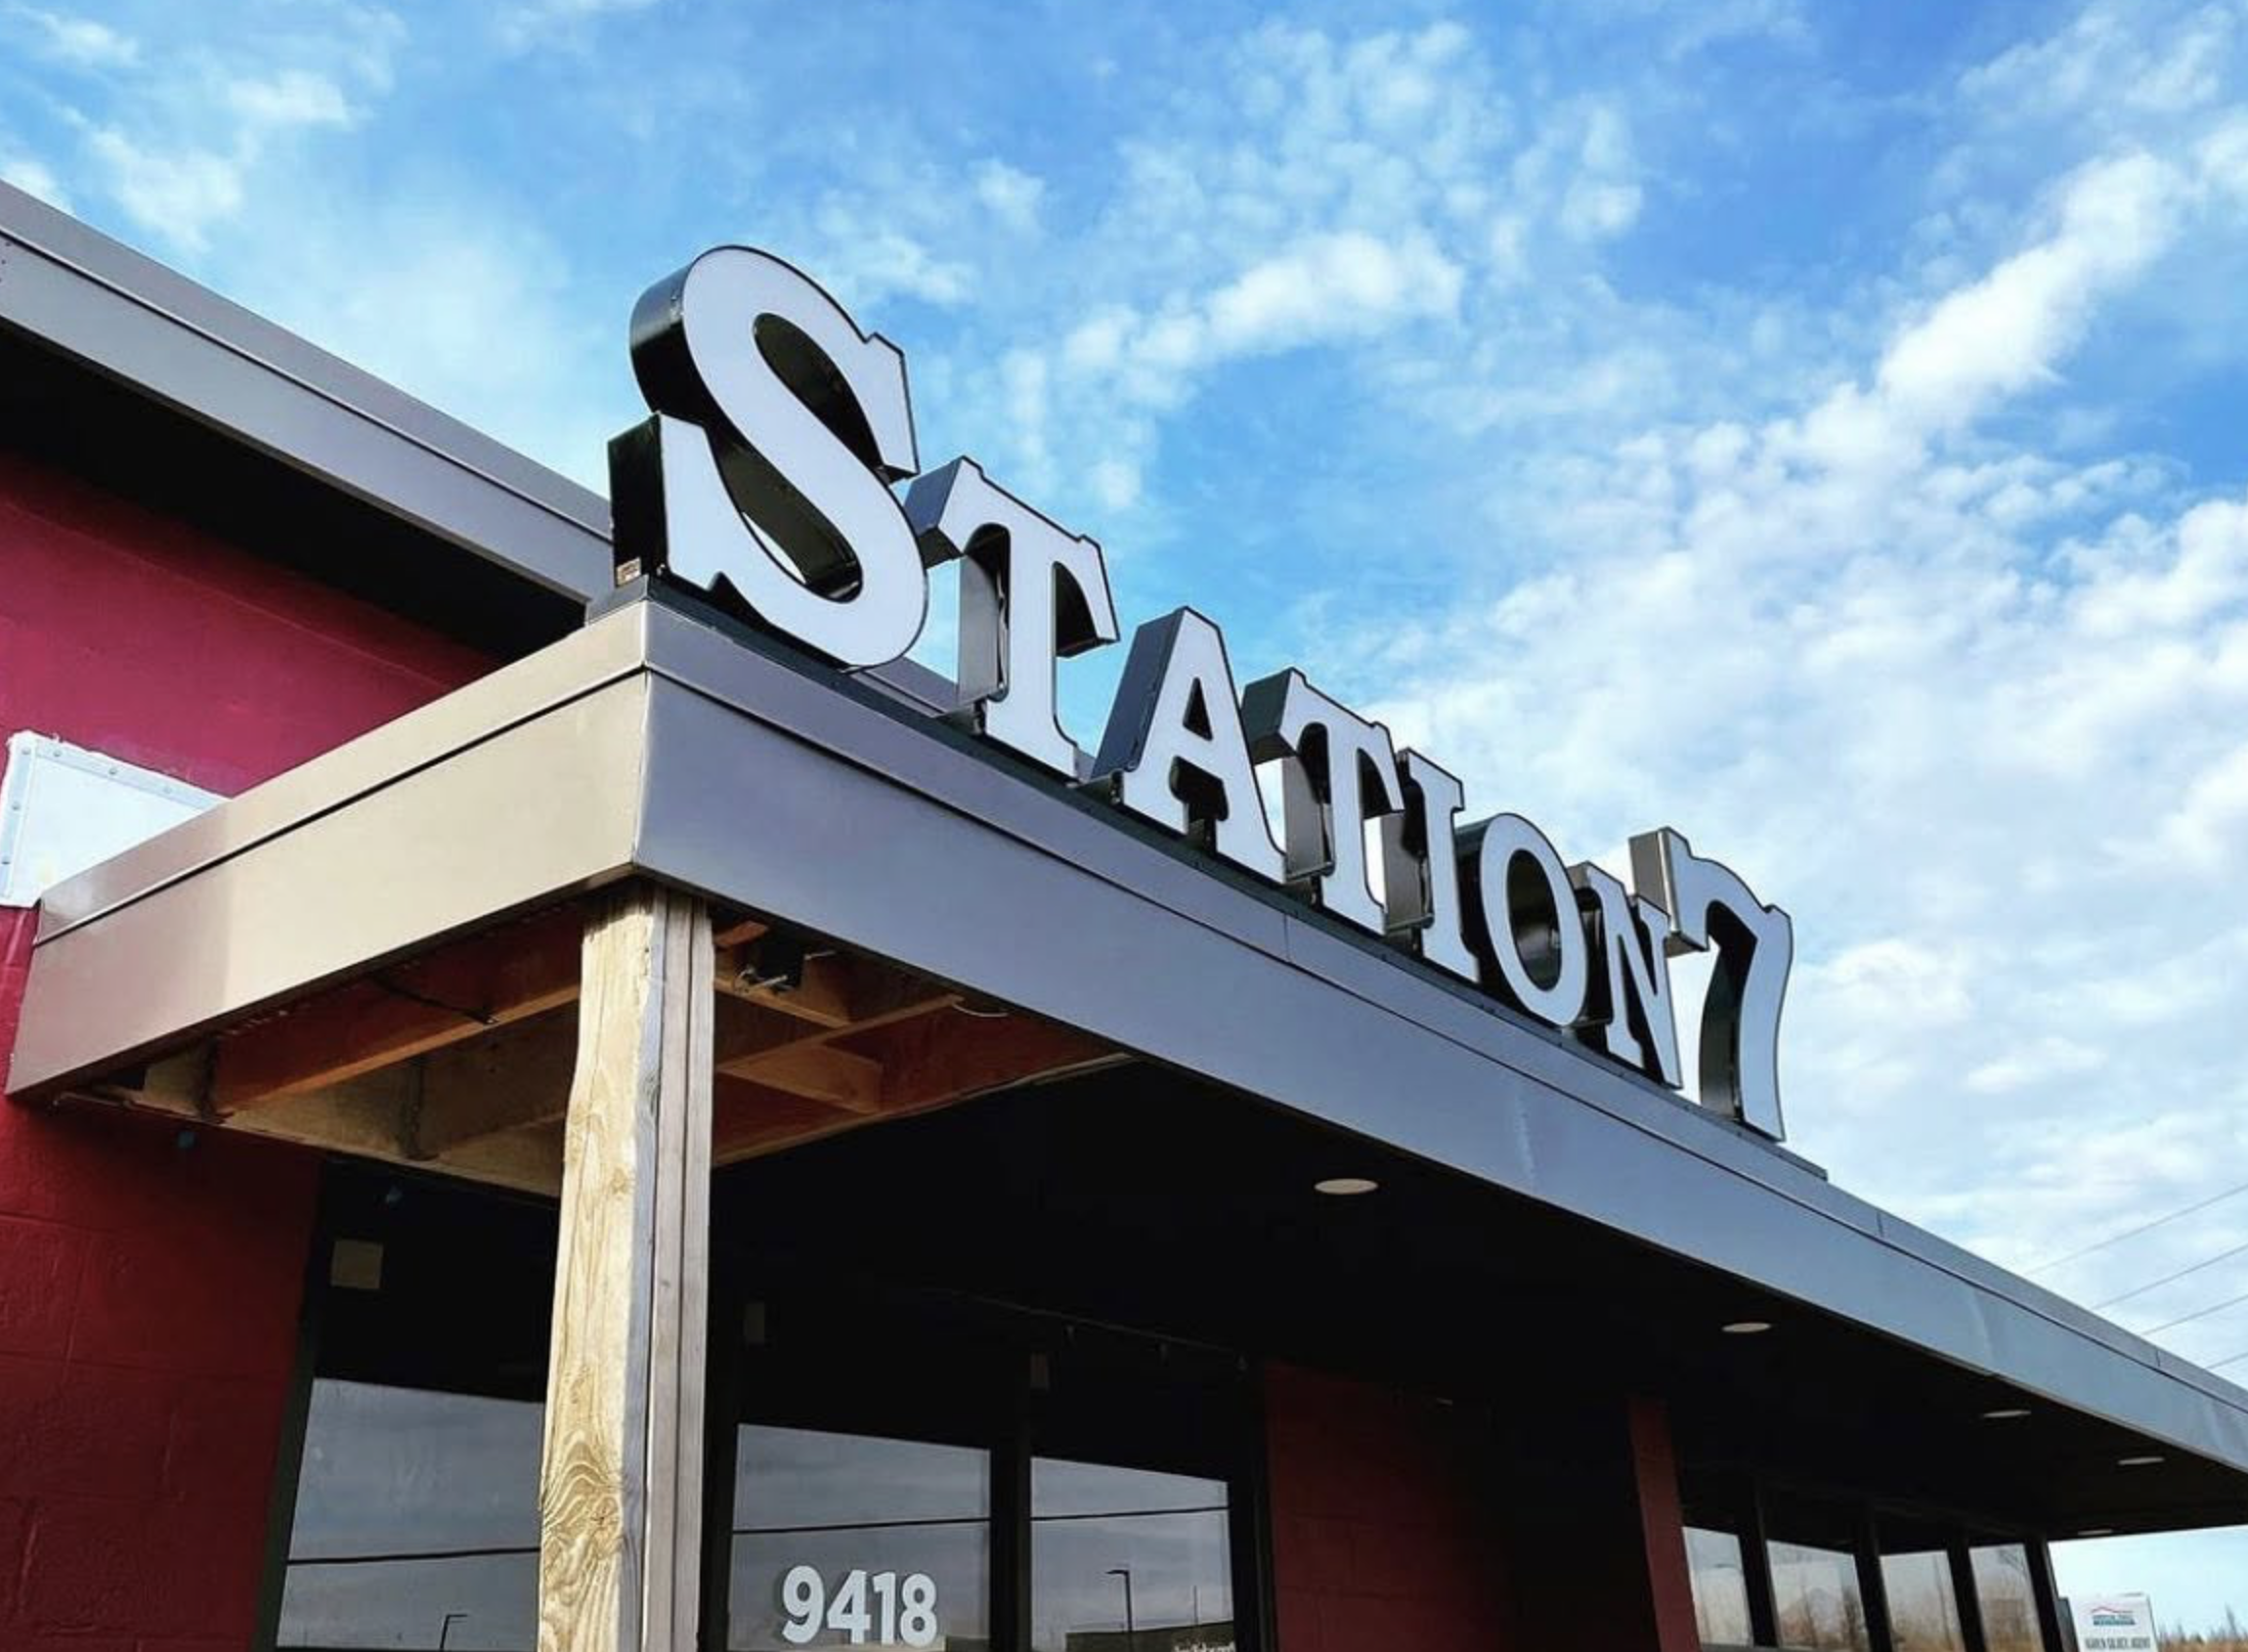
Martin City Brewing Company’s Station 7 location knew there were opportunities to improve its draft program. In one week, PourScore™ showed $3,705.80 in ounces poured but never rung up. After PourScore™ calibration, that number was just $63.91.
"I believed we had some waste and some giveaway but once we saw the data, how could we not incorporate Floteq into our business? We would be burying our heads in the sand quite literally."
Matt Moore | Co-Founder & CEO Martin City Brewing Company
DRAFT CERTAINTY CHECKLIST
How many draft certainties can you check today?
You run food cost to the decimal and labor by the hour. Your highest-margin item gets a keg count and a shrug. Place a checkmark on every line that is true at your bar right now.
Start tapping
Your gaps show up here.
Based on your answers. Not a measurement of your system.

“Your point of sale is not lying to you. It just doesn't know what happened at the tap. It knows what was rung up. Not what's left in the keg, not what hit the drain, not what walked out between shifts. We call that gap the Draft Tax. It's invisible until you close it.”
-Nick Spohn | Co-Founder & CEO

WHAT POURSCORE™ DELIVERS
Three questions. One number.
One daily score per location. Above 90%, your program is behaving. Below it, the system points you to the line and the shift.
Draft flow data is live on your dashboard in as few as 24 hours after install. Your tap list, live on your TVs with FloBoard™, included at no additional cost with every PourScore™ subscription.
REVENUE
Is every ounce getting paid for?
Poured vs. rung, by line and by shift. Variance shows up the same day, not at month-end.
QUALITY
Is the beverage quality good?
Temperature and pressure tracked on every line. Drift gets flagged while you can still fix it.
CLEANINGS
Is the system properly maintained?
Cleanings events logged automatically and accounted for, not self-reported.
BACKED BY CERTIFIED PARTNERS
Software doesn't clean a line. People do.
Every PourScore™ install is performed by a Floteq Certified Partner: a local draft technician trained on our install spec and accountable to our installation and service standards.
Our certified Service Partners install the hardware, calibrate the system, and stay on the account. Because they see your line data in real time, they know a line is drifting before you place a service call.
Certified, not just contracted
Every partner completes Floteq training and holds certification per account. The standard is a commitment to get your draft system running profitably.
They see what you see
Your certified partner monitors temperature, pressure, and cleaning data on your system continuously. Problems get diagnosed before the truck rolls.
Incentivized by your uptime
Partners are incentivized by Floteq for every account they maintain. Their incentives are tied to your system running right, for as long as you're a client.
WHO WE WORK FOR
One score. Everyone who serves draft wins.
Multi-Location Groups with 2 to 20+ locations
Standardize draft the way you standardize food. Compare locations fairly, end the monthly "why is this location off" argument, and give ops one source of truth.
High-Volume Single Locations
Tighten the system and keep more of what you sell. No extra steps for your staff, no mystery losses after the month closes.
Enterprise Venues: Casinos, airports, stadiums, hotel chains
Governance-ready reporting across venues, bars, and service teams. When the asks come for draft accountability, you hand them numbers.
POS INTEGRATIONS
Works with your POS





And more…
Trusted by serious operators.
Owners & operators who came for clarity and now run their draft program with certainty & control.

Real-time monitoring of every draft line.
- Ounces poured vs. sold
- Temperature
- Pressure
- Sanitation
Know exactly where margin is leaking before it hits your P&L.
Real-time POS sync
Every pour reconciled to sales with keg margins built-in.
After-hours detection
Instant alerts when beer moves outside of venue operating hours.
Line cleaning detection
Protect draft quality, and keep cleans out of your beer numbers.
Multi-location portfolio view
Every site on the same measure & accountability for every ounce.
Hardware and installation
~$2,500 value. Proprietary hardware installed by our service partners.
FloBoard™ digital draft menu
Your taps, live on a screen to promote beverages & more.
Certified local Service Partner
On your account to proactively optimize your draft system.
DRAFT INSIGHTS
What we’re seeing in the data.
