DRAFT PROFIT OPTIMIZATION
Every ounce you pour, matched to every ounce you sell.
PourScore™ utilizes proprietary sensors on every draft line to reconcile what leaves the keg against what rings in your POS. Variance shows up the same day, by line and by shift.
You can’t unsee the certainty, clarity, and control PourScore™ delivers.
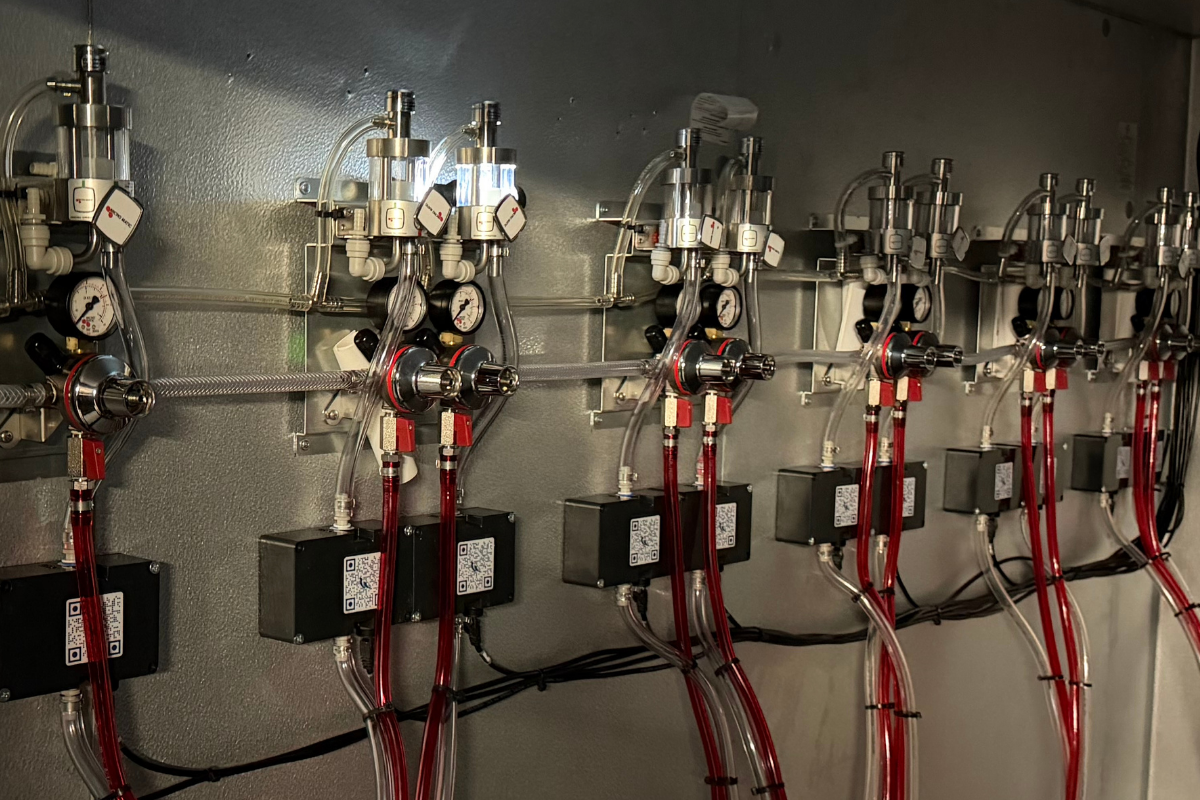
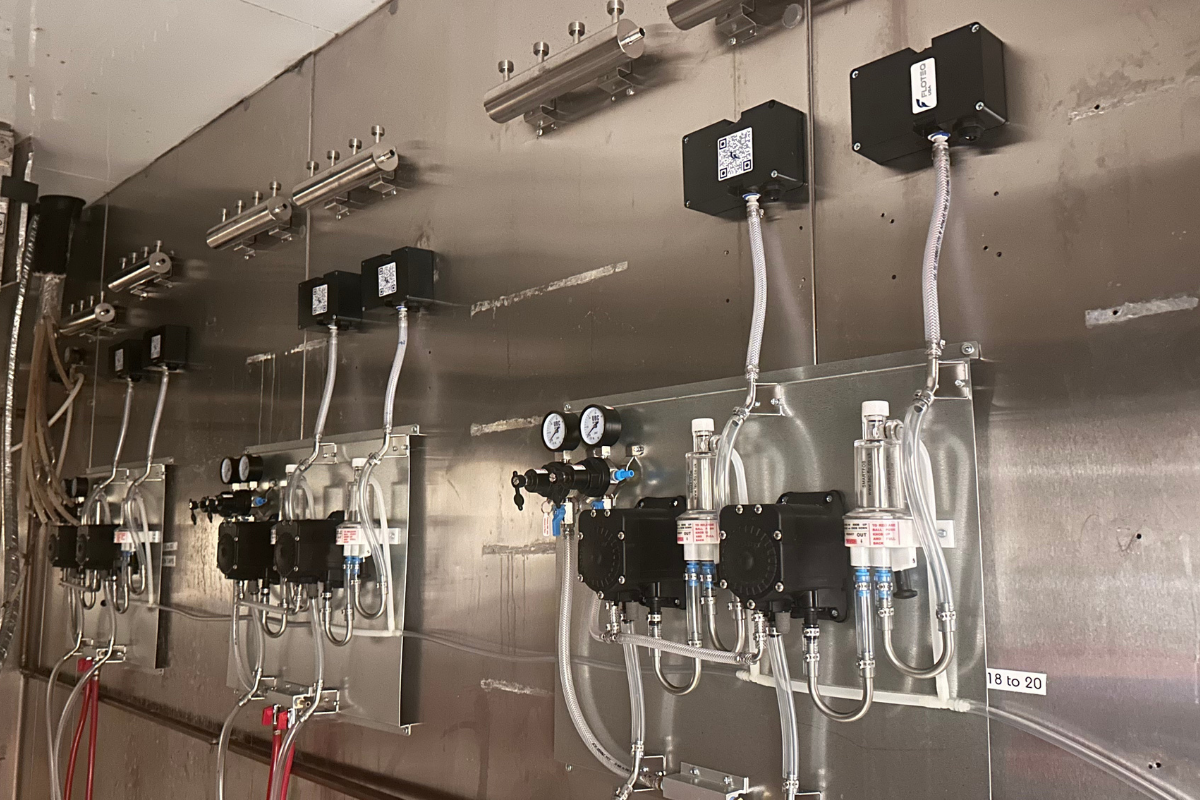
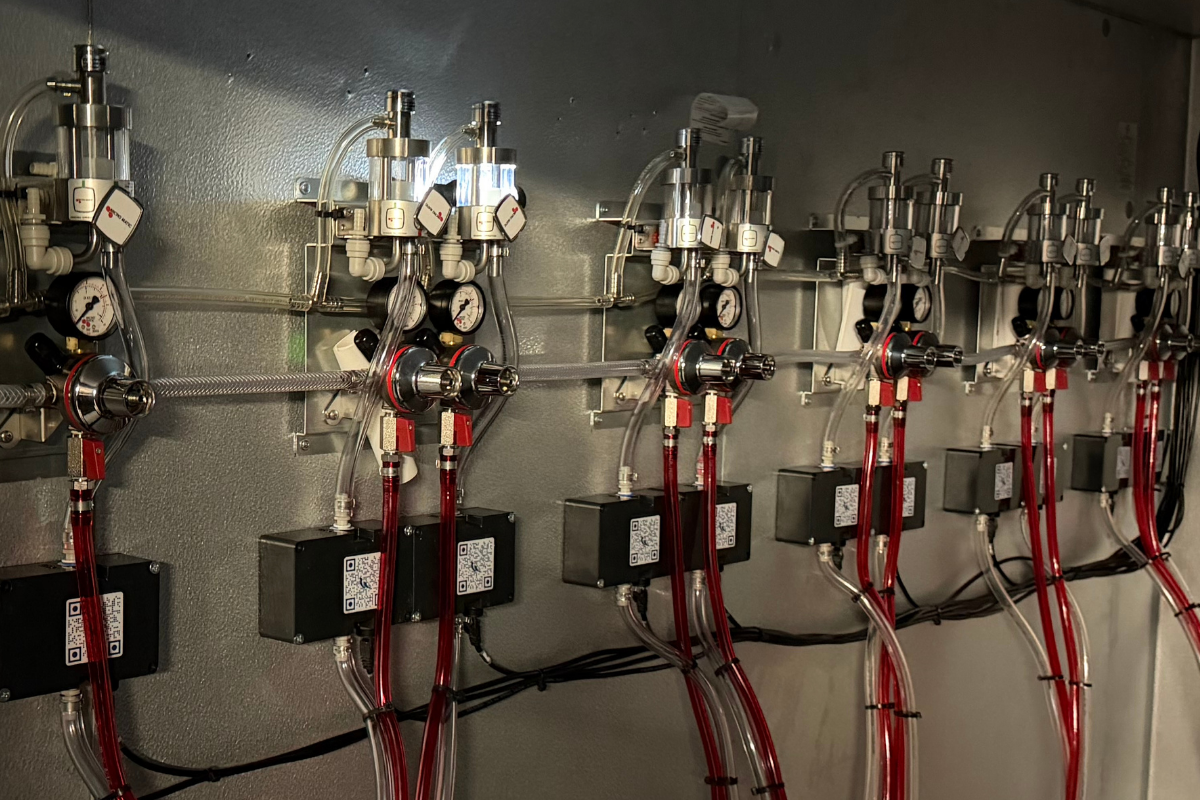
Floteq draft line sensors installed in keg room

PourScore™ dashboard and mobile app + FloBoard™ draft promo display
REAL-TIME DATA
Four things, measured continuously, on every line.
OZ - BY LINE
Volume
Every ounce poured, across every line, timestamped and reconciled against POS sales automatically.
°F TARGET RANGE - BY LINE
Temperature
Continuous monitoring against your target range. Alerts when a line drifts and temperatures fall out of range.
PSI - BY LINE
Pressure
Caught before it turns into foam and waste. Paired with temperature settings for perfect pours.
CLEANING LOGS - BY LINE
Sanitation
Cleaning events logged automatically. Cadence verified, not self-reported, to uphold draft line sanitation standards.
Trusted by serious operators.
Owners & operators who came for clarity and now run their draft program with certainty & control.

PROOF
Same taps. Same staff. Unsold pours down 98% in one week.
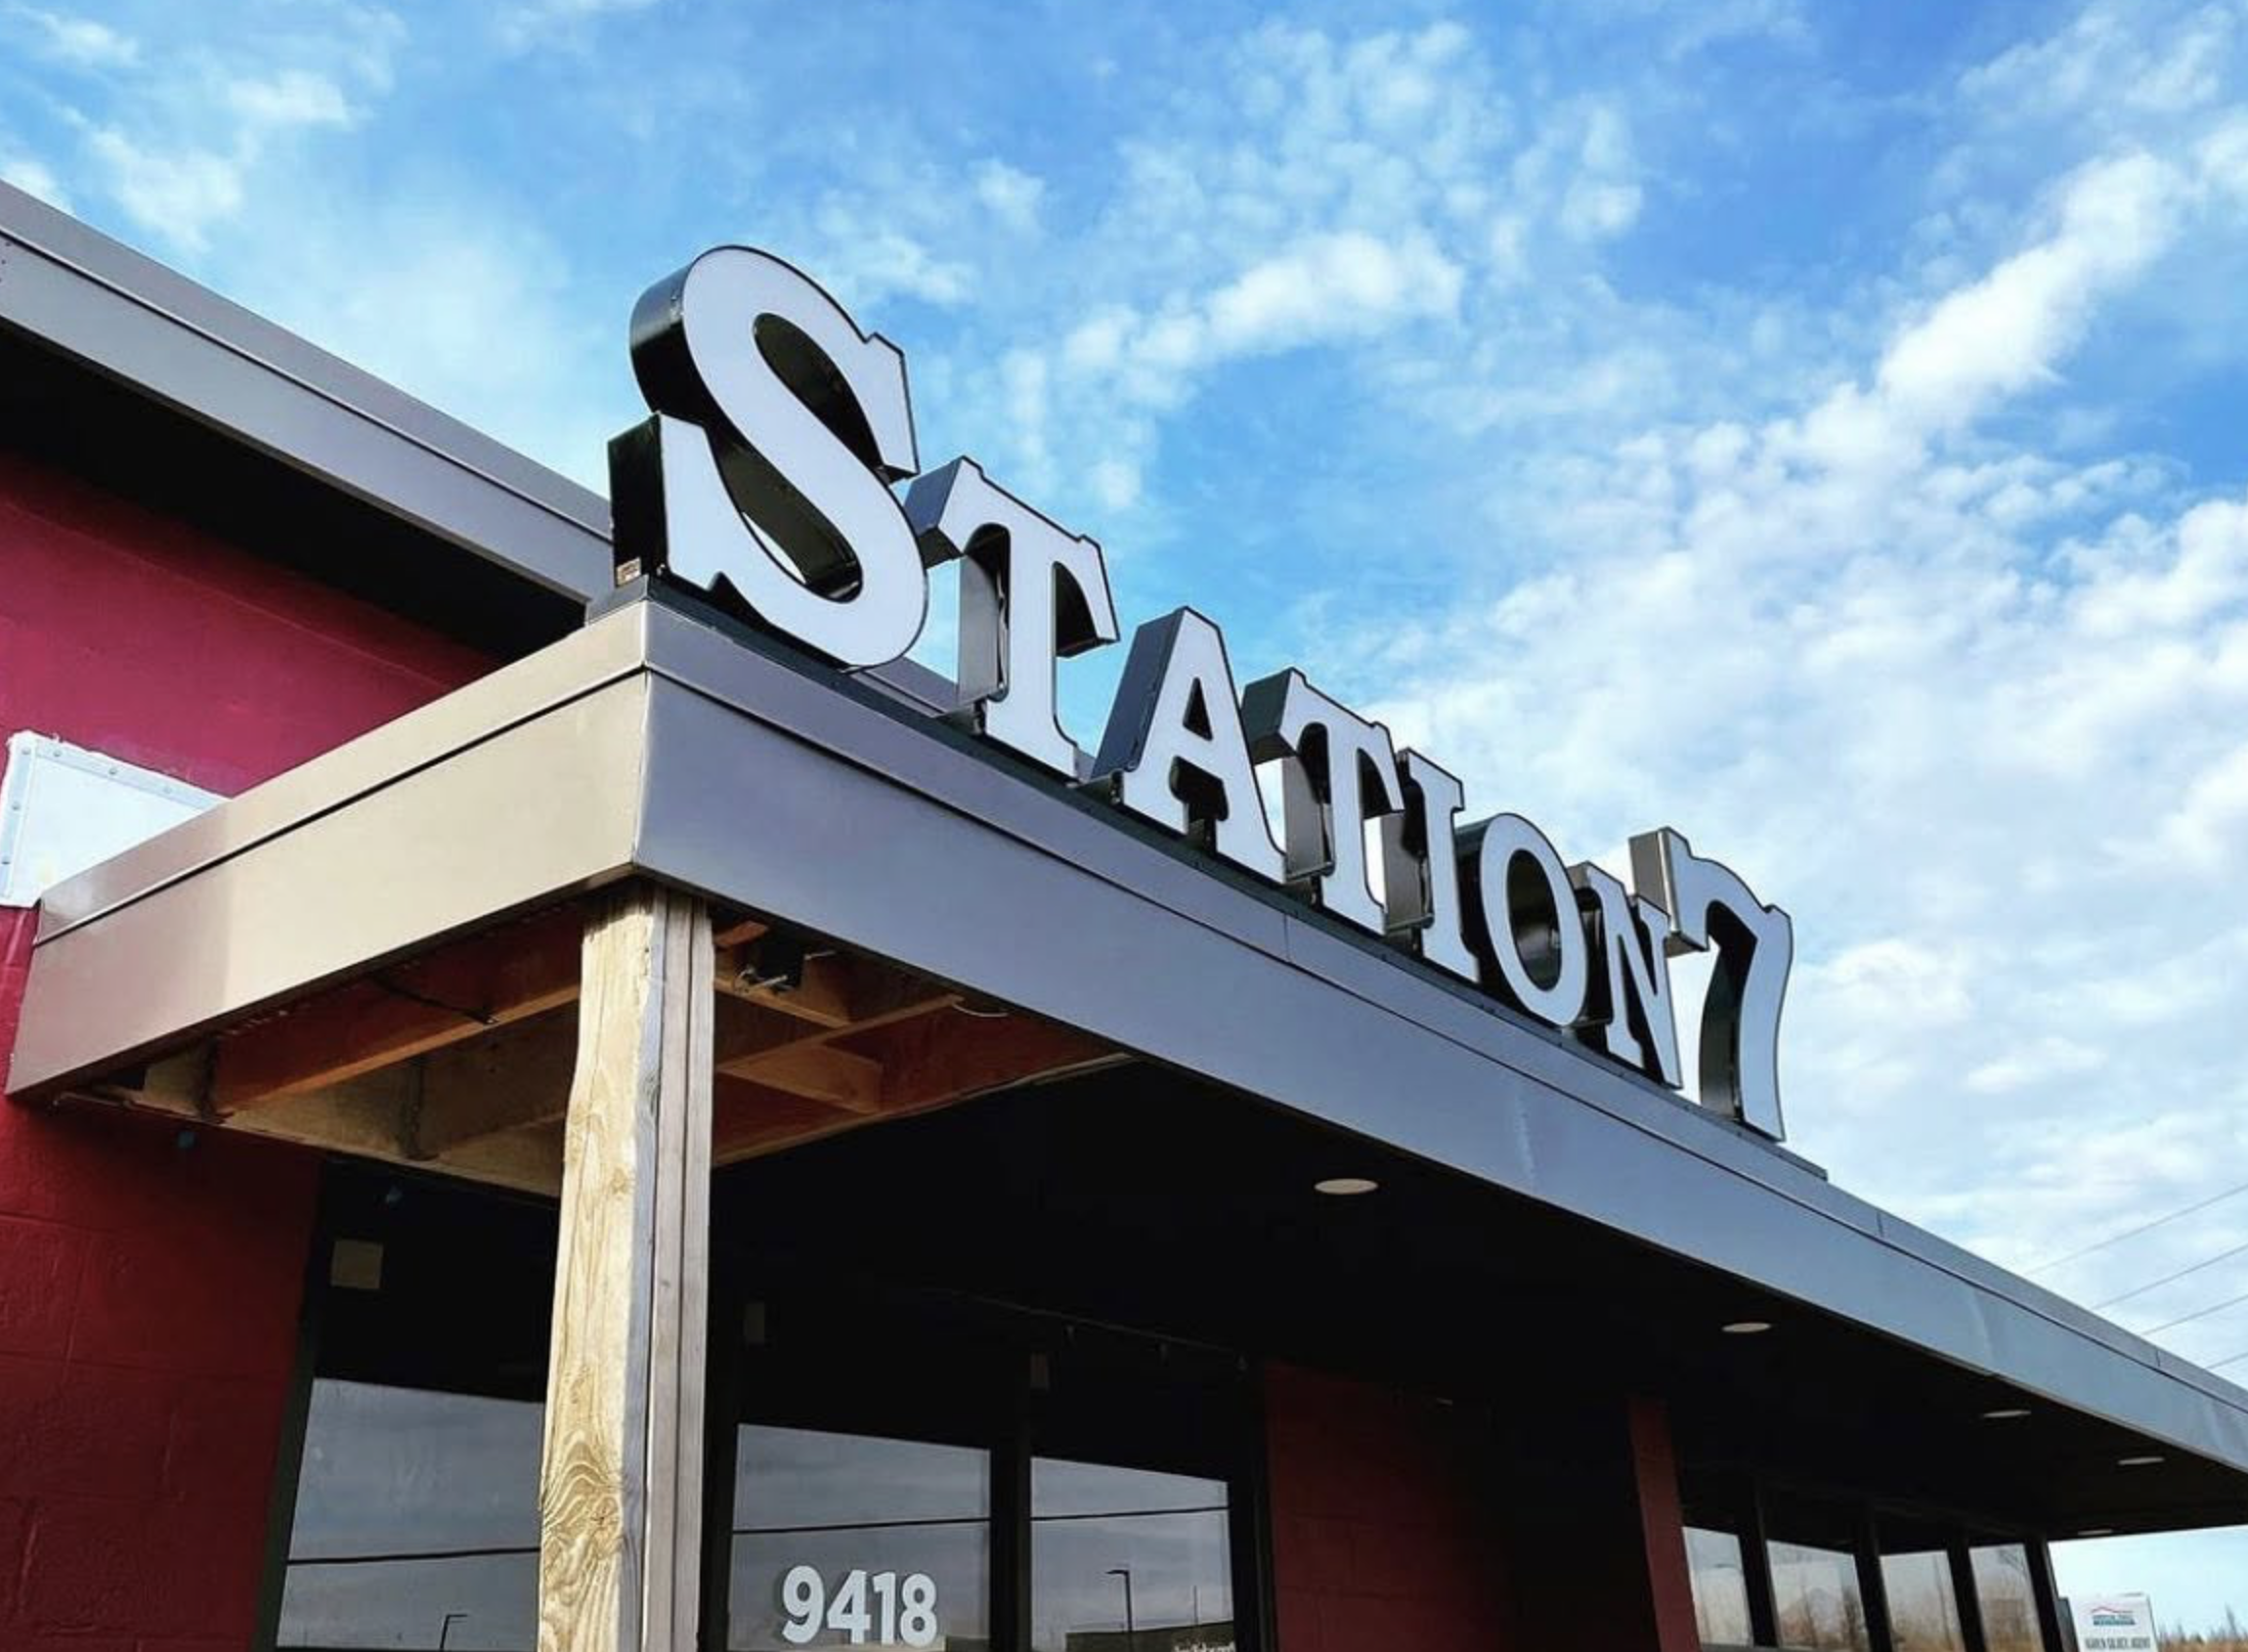
Martin City Brewing Company’s Station 7 location knew there were opportunities to improve its draft program. In one week, PourScore™ showed $3,705.80 in ounces poured but never rung up. After calibration, that number was $63.91.
"I believed we had some waste and some giveaway but once we saw the data, how could we not incorporate Floteq into our business? We would be burying our heads in the sand quite literally."
Matt Moore | Co-Founder & CEO Martin City Brewing Company
HOW IT WORKS
From install to first insight in under a week.
We designed our hardware, software, and service to work in any keg beverage system. Retrofit or new install. Keg-orator or mobile beverage cart. Our certified Service Partners run the install and stay engaged to continually optimize your draft system.
1. Site Survey
A Floteq certified Service Partner conducts a site survey (new build or retrofit) to assess the current state of your draft system to ensure a strong system exists before we calibrate Floteq sensors.
2. POS Integration
We connect your POS ahead of install day, so poured ounces are matched against sold ounces from the first pour, line by line. No estimates, no manual counts, no delayed, static POS reporting.
3. Hardware Install
Floteq's proprietary sensors get installed in your keg room for every tap line and connected to our BrainBox. No downtime, no disruption to service. The system is passive and does not impact beverage flow.
4. Calibration
We calibrate every draft line to specific metrics to set your initial pour standards. This step makes the flow metrics yours instead of generic. Benchmarked ROI from day one, your draft data is live in as little as 24 hours after install.
POS INTEGRATION
Works with your POS





And more…
CERTIFIED SERVICE PARTNERS
Your PourScore™ system comes with a draft service partner, not a support ticket.
Every PourScore™ install is performed by a Floteq Service Partner: a local draft technician trained on our install specification and accountable to top-tier draft standards.
They don't just hand off the system after install. Our Service Partners stay engaged with read-only access to your real-time line data to maximize your draft system for consistency and beverage quality.
Certified to a Floteq standards
Every Service Partner completes Floteq Certification per account: install spec, data fluency, and a 48-hour response commitment to help optimize your draft system.
They see what you see
Temperature, pressure, and cleaning data on your system, monitored continuously by the person who services it.
Accountable, and replaceable
If a Service Partner isn't meeting the standard on your account, let us know and we'll tap another partner in our network so coverage doesn't lapse.
CLARITY. CERTAINTY. CONTROL.
The PourScore number tells you something is off. The system tells you what to fix.
Daily variance by line
See which line, which shift, which day-part. Stop guessing which bartender or which keg.
Alerts that reach you
Temperature, pressure, and after-hours pour activity, pushed to your phone. Not buried in a report nobody opens.
Multi-location rollup
Every location, one view, same metric. Compare fairly. End the monthly argument.
PUT REAL-TIME DATA TO WORK
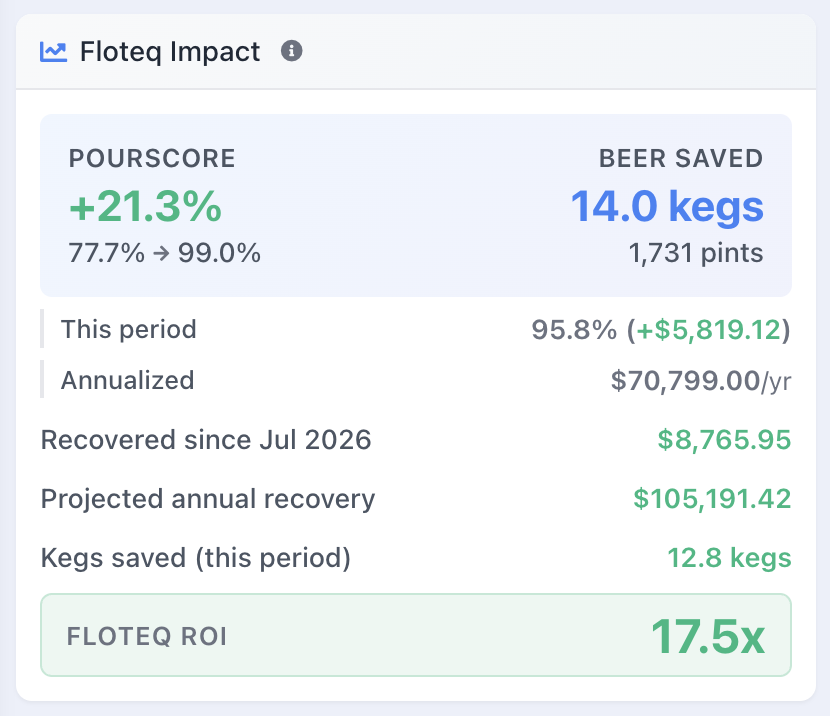
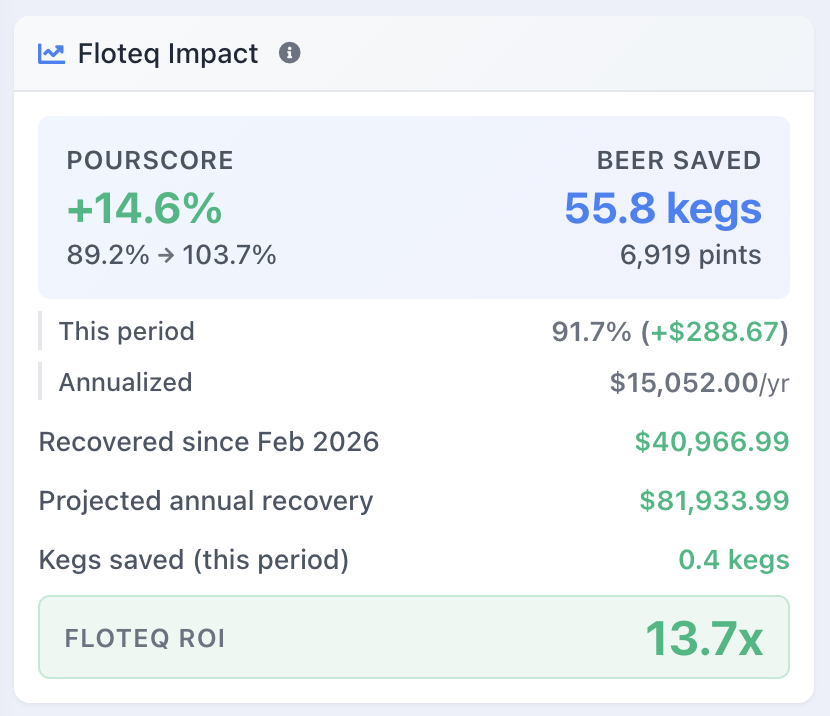
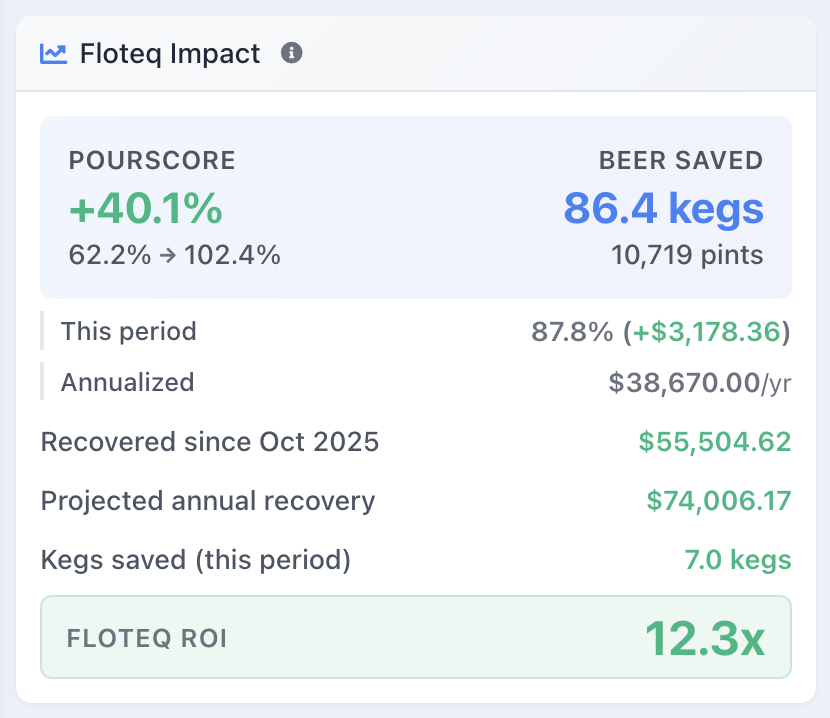
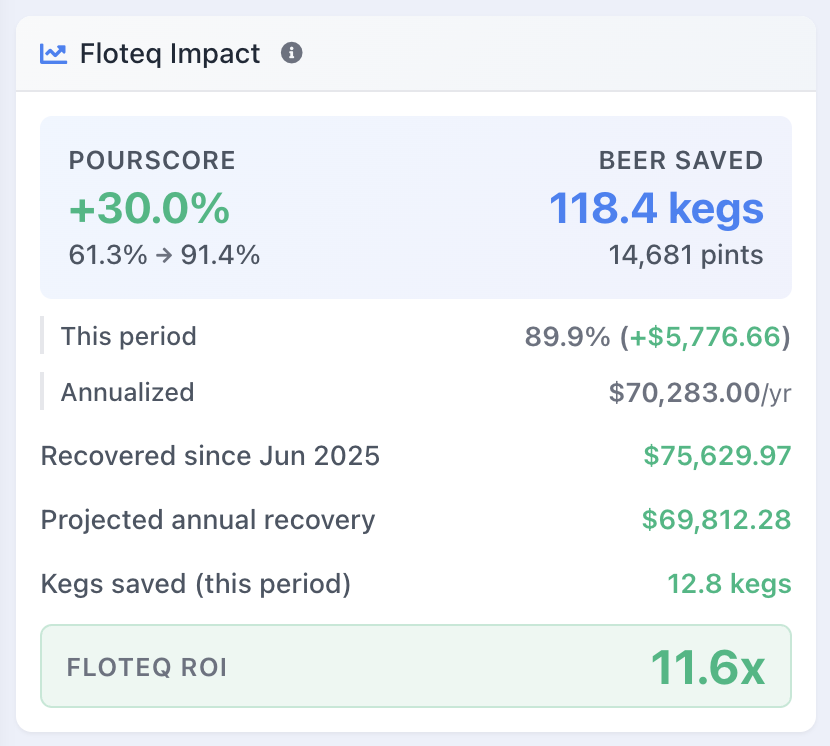
Data that tells an ROI story.
Real clients. Real ROI. Real profits to reinvest in their respective venues. 96 data points every 5 seconds.
POURSCORE™ PRICING
Simple pricing. No surprises.
We handle installation, hardware, and POS integration. Your team sees real time data to calibrate your draft system for maximum profit and beverage quality. After 90 days, you have options to pay monthly or annually to receive two free months of service.
Our demo call is a great opportunity to level-up your visibility into draft optimization, team & vendor accountability, and beverage quality.
> 30-minute demo with a live dashboard
> Q&A regarding your draft system today
> Your ROI estimate before the call ends
per location *
- Keg room hardware
- FloBoard draft menu
- Professional install
- Unlimited users
- POS integration
- $0 upfront
After 90 days, choose how you pay
Pay monthly
$500 / monthper location*
The same rate you started at.
Pay annually
$5,000 / yearper location*
One invoice instead of twelve.
Save $1,000 per location, every year
* One BrainBox covers up to 24 draft lines. Locations running more lines add units. Every location reports into one dashboard. Monthly and annual plans both run on a 12 month term after the first 90 days. Venue-specific pricing evaluated after demo.
FAQ
-
Most installs are done in a day. Your data is live within ~24 hours. We work around your service hours. Our sensors install in your existing keg room or kegerator and our BrainBox connects to your Ethernet or wifi network to collect and report data.
-
Toast, Shift4, Clover, Aloha, Square, SpotOn, and Heartland are live. If yours isn't listed, let us know on your demo call and we’ll work through integration details with your POS provider.
-
A certified Floteq Service Partner in your market. They handle install and calibration, then stay on the account with real-time visibility into your system to optimize your draft lines for profit and beverage quality.
-
No. Sensors sit on the every draft line and the data flows on its own. Nothing changes behind the bar. If a brand changes on a draft line, simply update your Floteq account via the mobile app or desktop portal. No babysitting required.
-
Floteq supports enterprise-scale clients. Admin users can view and manage PourScore™ performance, waste, and compliance across all locations in one dashboard interface. Management of FloBoard™ displays is also handled from the same login to promote draft beverages on one or many screens at your venue(s).
-
We have clients that measure over 100 draft lines from a single location, in real-time. Standard installations run on one BrainBox to monitor up to 24 draft lines. Additional BrainBoxes can be added to your Floteq system to optimize draft quality across any number of tap lines.